

Stop Guessing If Your Edge Is Real
The quant-grade trading journal that reveals what's actually making you money and what's slowly bleeding your account dry. No cloud uploads. No $150/month subscriptions. Just brutal honesty about your trading.
PROBLEM SECTION — "Why Most Journals Fail You"
Section Title: Your Current Journal Is Lying to You
Most trading journals are glorified spreadsheets with pretty charts. They show you:
- ✅ Win rate
- ✅ Total PnL
- ✅ Number of trades
They don't show you:
- ❌ That your "best setup" is actually losing money after fees
- ❌ That your edge has decayed 40% in the last 30 trades
- ❌ That your EURUSD longs and GBPUSD longs are the same correlated bet
- ❌ That you lose 73% of trades taken after 2 consecutive losses (tilt pattern)
- ❌ That you're leaving 38% of potential profit on the table by exiting early (MFE analysis)
The Trader Journal App shows all of this — and more.

FEATURES SECTION
Quant-Grade Analytics (Not Vanity Metrics)
16+ institutional metrics that prop firms actually care about:
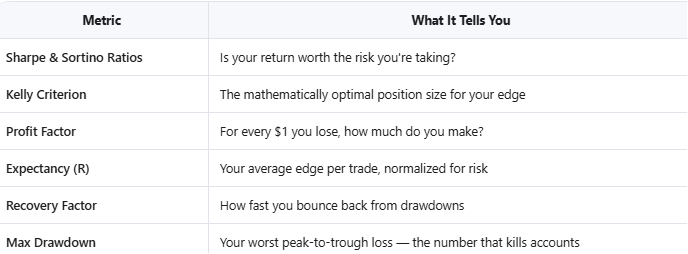
Edge Decay Detection
Your rolling 20-trade expectancy is tracked in real-time. When your edge drops below 0.2R, a red warning banner flashes across your dashboard:

This is the #1 feature prop firm risk managers use to detect blown accounts before they happen. You'll have it on your own dashboard.
Execution Quality (MAE vs MFE)
Every trade is plotted on a scatter chart showing:
- MAE (Max Adverse Excursion): How much heat you took before the trade worked
- MFE (Max Favourable Excursion): How much profit was available before you exited
Insight: If your winners cluster in the top-right quadrant, you're leaving money on the table. If they cluster bottom-right, you're taking unnecessary heat. This single chart transforms your exit strategy.
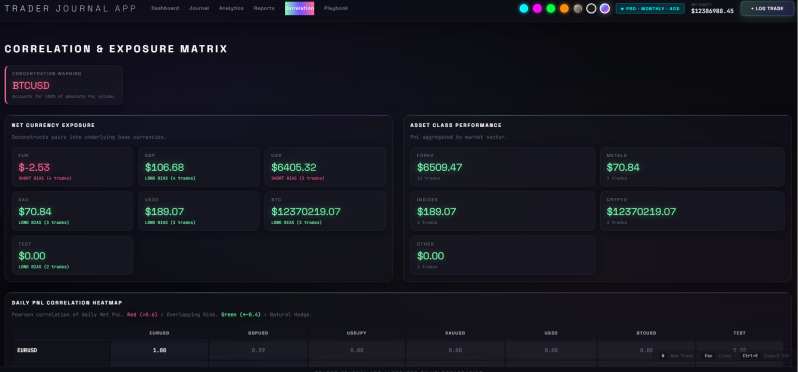
Correlation & Exposure Matrix
The feature no other retail journal has.
A Pearson correlation heatmap of your daily PnL across every asset you trade. Red cells (>0.6) = overlapping risk. You think you're diversified, but your EURUSD, GBPUSD, and XAUUSD longs all move together — you're just 3x leveraged on USD weakness.
Plus: Net currency exposure breakdown by base currency (EUR, GBP, JPY, XAU, BTC) so you see your real directional bias.
Granular Breakdowns
Slice your performance by:
- Asset (with Max DD, Max Consecutive Losses, Fee Drag per asset)
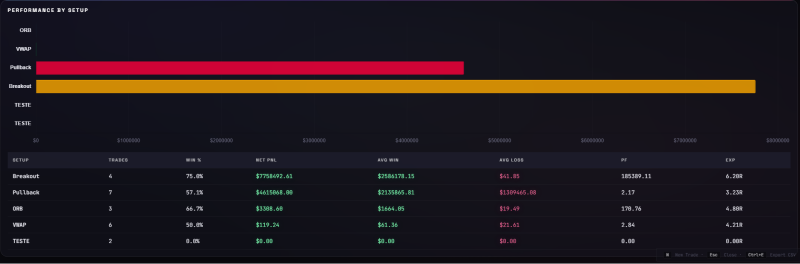
- Setup (ORB, VWAP, Breakout, Pullback — see which is your true edge)
- Direction (Long vs Short performance)
- Day of Week (Are you bleeding money on Fridays?)
- Session (Morning / Afternoon / Evening PnL)
- Streak Impact (What happens after 2 wins? 3 losses? This is where tilt lives)
Visual Intelligence
- Monthly PnL Heatmap — See your best and worst months at a glance
- R-Multiple Distribution — Is your strategy right-skewed (more +2R, +3R than -1R)?
- Rolling 20-Trade Expectancy Chart — Watch your edge strengthen or decay over time
- Equity Curve with Drawdown Overlay
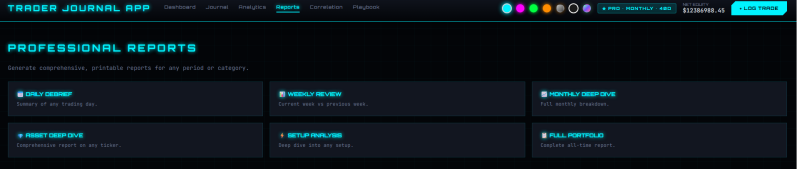
Professional Reports
Generate printable, exportable reports in one click:
- 📅 Daily Debrief — Summary + trade log + automated insights
- 📊 Weekly Review — Current week vs previous week comparison
- 📈 Monthly Deep Dive — Top setups, max drawdown, expectancy
- 💎 Asset Deep Dive — Long vs Short breakdown per ticker
- ⚡ Setup Analysis — Is your ORB setup actually profitable?
- 📋 Full Portfolio Report — Complete all-time performance
Each report includes automated insights that flag:
- Win rate anomalies
- Profit Factor below 1.0
- Worst trade 2x larger than best trade (risk management failure)
- Positive expectancy edges worth doubling down on
7 Stunning Themes
Your journal should match your vibe:
Built for Speed
- N — New trade
- Esc — Close any modal
- Ctrl+E — Export CSV
- Clone button — Duplicate trades for rapid-fire sessions
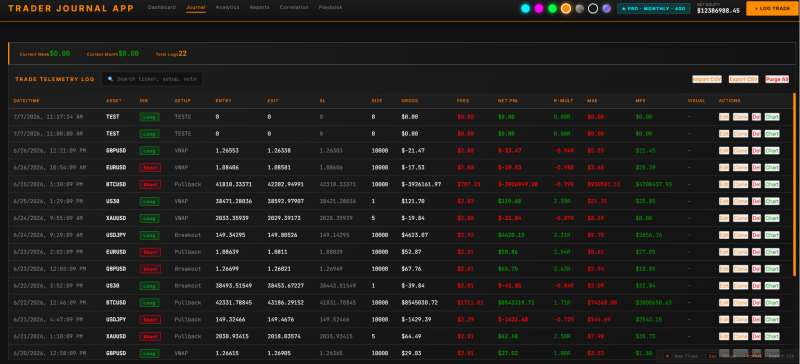
- Live search — Filter by ticker, setup, notes instantly
- Inline chart viewer — Click any trade to open TradingView with that ticker
- Screenshot lightbox — Attach and view trade screenshots full-screen
📥 Import & Export
- CSV Import — Migrate from any broker or existing journal
- CSV Export — Your data, always portable
- No vendor lock-in — Ever
Add comment
Comments