

B+S SYSTEM BY VELDORA - COMPREHENSIVE TRADING INDICATOR
Advanced Multi-Component Indicator for TradingView
Click the images to enlarge
OVERVIEW
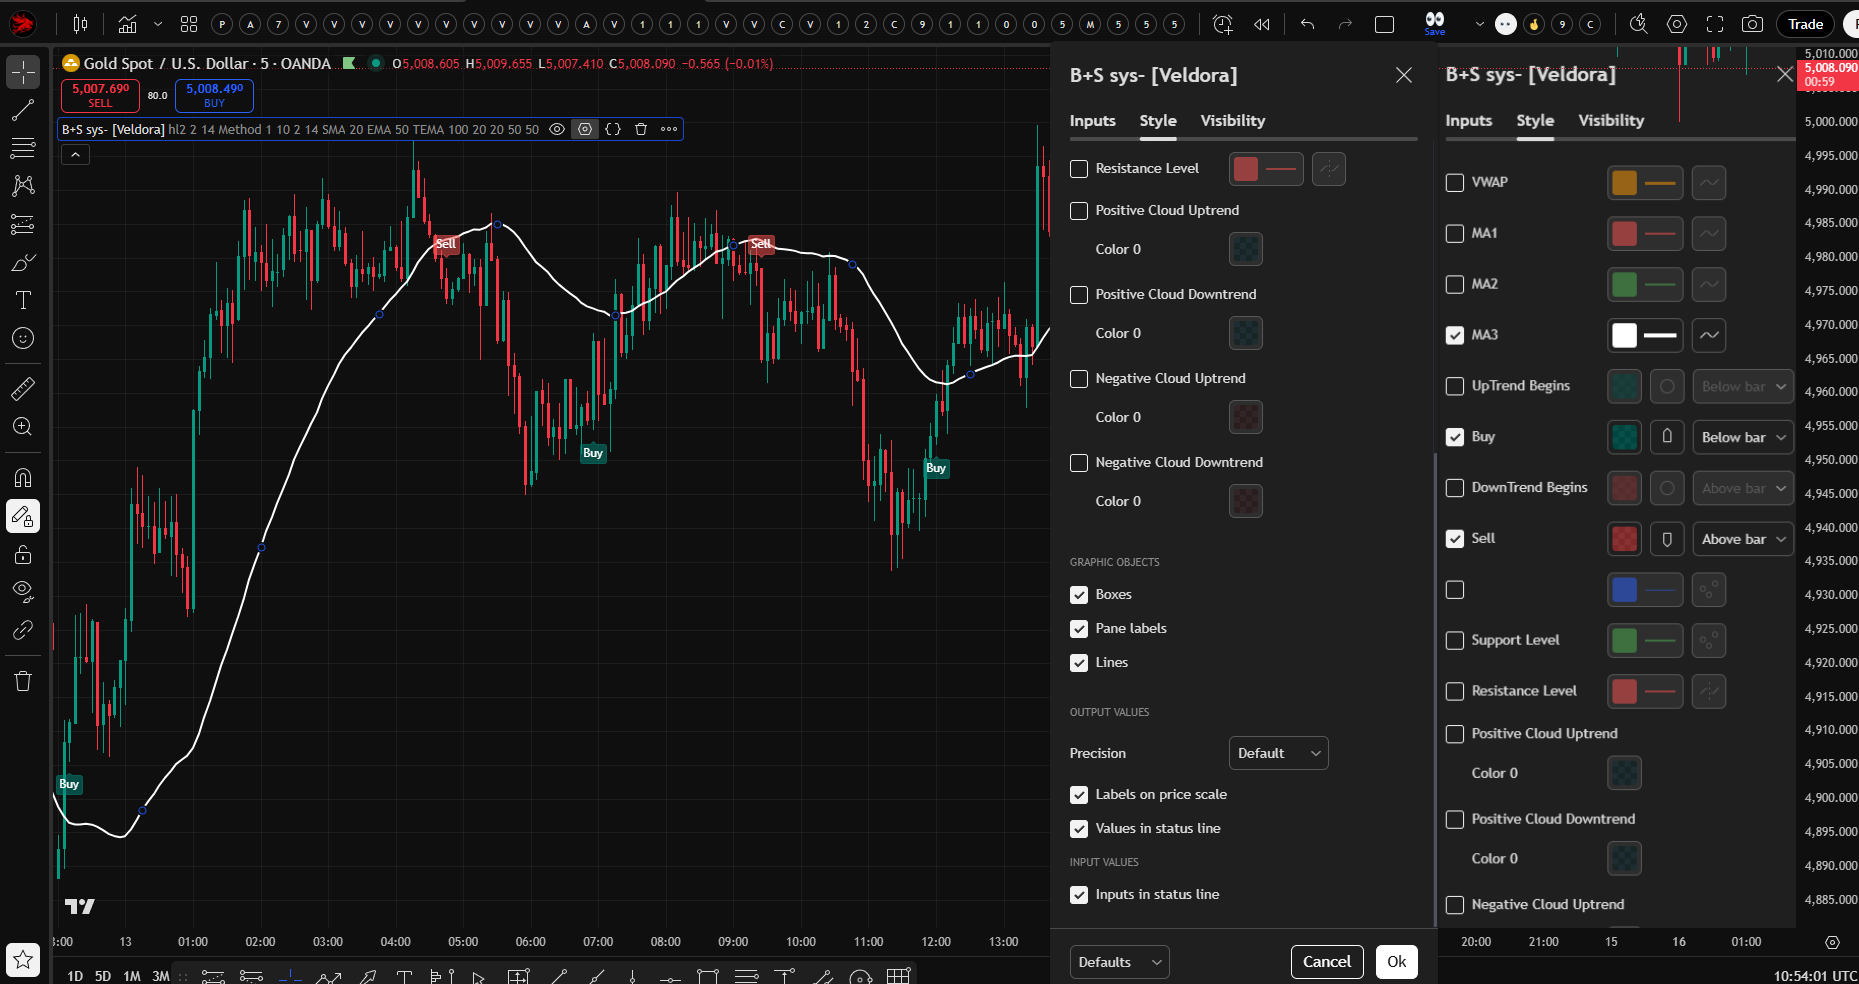
The B+S System by Veldora is a sophisticated, all-in-one trading indicator that combines trend detection, momentum analysis, support/resistance identification, and supply/demand zone mapping into a single, powerful tool. Designed for traders who demand precision and clarity, this indicator provides actionable buy and sell signals with clearly defined entry points, multiple take profit levels, and stop loss targets.
Unlike simple moving average crossover systems, the B+S System employs a multi-layered approach that analyses market structure from multiple perspectives simultaneously, ensuring that signals are generated only when conditions align across trend, momentum, volatility, and price action.
KEY FEATURES AT A GLANCE
✓ ATR-Based Trend Detection - Dynamic supertrend with two calculation methods
✓ RSI + CMO Confluence Signals - Momentum and oscillator convergence
✓ VWAP Integration - Volume-weighted average price for institutional levels
✓ Triple Moving Average System - SMA, EMA, TEMA, WMA with customizable lengths
✓ Automated Take Profit Levels - Three progressive targets (1:1, 2:1, 3:1 risk-reward)
✓ Dynamic Stop Loss - Percentage-based protection with visual display
✓ MACD Cloud Visualisation - Trend strength and direction indicator
✓ Support & Resistance Levels - Automatic identification of key price levels
✓ Supply & Demand Zones - Visual boxes showing institutional interest areas
✓ Real-Time Alerts - Instant notifications for buy/sell signals with full trade details
✓ Clean Visual Interface - Colour-coded signals and professional chart presentation
#indicators #custom #customindicator

HOW THE INDICATOR WORKS
HOW THE INDICATOR WORKS
CORE SIGNAL GENERATION ENGINE
The B+S System uses a sophisticated trend-following mechanism built on ATR (Average True Range) supertrend logic combined with RSI and CMO oscillator confirmations.
COMPONENT 1: ATR SUPERTREND SYSTEM
The foundation of the indicator is a dynamic ATR-based supertrend that adapts to market volatility.
How It Works:
The system calculates upper and lower bands around the price using ATR (Average True Range) multiplied by a sensitivity factor. These bands act as dynamic support and resistance levels that expand and contract with volatility.
Calculation Process:
• Upper Band = Source Price - (Sensitivity × ATR)
• Lower Band = Source Price + (Sensitivity × ATR)
• Default Source: HL2 (average of high and low)
• Default Sensitivity: 2.0
• Default ATR Length: 14 periods
The bands are "trailing"—meaning they move in the direction of the trend but never reverse unless the price crosses them. This creates clear trend zones:
• When price is above the lower band → Uptrend
• When price is below the upper band → Downtrend
Two ATR Calculation Methods:
1. Method 1: Standard ATR function (default)
2. Method 2: Simple Moving Average of True Range
This flexibility allows you to choose between the smoothed exponential calculation (Method 1) or the simpler arithmetic average (Method 2) based on your preference.
COMPONENT 2: RSI + CMO MOMENTUM CONFIRMATION
The indicator doesn't generate signals based solely on trend direction. It requires momentum confirmation from two independent oscillators.
RSI (Relative Strength Index):
• Calculated on a 9-period basis
• Oversold threshold: < 25
• Overbought threshold: > 75
CMO (Chande Momentum Oscillator):
• Custom calculation using HMA (Hull Moving Average) for smoothing
• Bullish threshold: > 50
• Bearish threshold: < -50
Pivot Point Confirmation:
The system also checks for swing pivot points:
• Low pivot confirmation for buy signals
• High pivot confirmation for sell signals
Signal Generation Logic
BUY SIGNAL triggers when:
• Trend changes from down to up (price crosses above lower band)
• RSI < 25 (oversold)
• CMO > 50 (positive momentum)
• Low pivot point present
SELL SIGNAL triggers when:
• Trend changes from up to down (price crosses below the upper band)
• RSI > 75 (overbought)
• CMO < -50 (negative momentum)
• High pivot point present
This multi-condition requirement ensures that signals occur at genuine inflexion points, not during choppy, sideways action.
COMPONENT 3: VWAP + TRIPLE MOVING AVERAGE SYSTEM
The indicator displays four distinct moving averages to provide a multi-timeframe trend perspective:
VWAP (Volume-Weighted Average Price):
• Length: 14 periods (customizable)
• Colour: Blue
• Purpose: Shows where institutions are positioned
• Significance: Price above VWAP = bullish institutional bias
• Significance: Price below VWAP = bearish institutional bias
MA1 (Fast Moving Average):
• Default Type: SMA
• Default Length: 20
• Colour: Red
• Available Types: SMA, EMA, TEMA, WMA
MA2 (Medium Moving Average):
• Default Type: EMA
• Default Length: 50
• Colour: Green
• Available Types: SMA, EMA, TEMA, WMA
MA3 (Slow Moving Average):
• Default Type: TEMA (Triple Exponential Moving Average)
• Default Length: 100
• Colour: Purple
• Available Types: SMA, EMA, TEMA, WMA
What is TEMA?
TEMA is a sophisticated moving average that applies triple exponential smoothing to reduce lag while maintaining responsiveness. It's calculated as:
TEMA = 3 × EMA1 - 3 × EMA2 + EMA3
This creates a moving average that responds faster to price changes than standard EMAs while filtering out noise more effectively.
How to Use the MA System:
• Price above all three MAs = strong uptrend
• Price below all three MAs = strong downtrend
• MAs in proper order (VWAP > MA1 > MA2 > MA3) = healthy trend structure
• Price between MAs = consolidation or transition zone
COMPONENT 4: AUTOMATED RISK MANAGEMENT
One of the standout features of the B+S System is its automatic calculation and display of entry, stop loss, and take profit levels for every signal.
Entry Price:
The exact price at which the signal was generated is recorded and displayed with a horizontal line extending from the signal bar to the current bar.
Stop Loss Calculation:
• Percentage-based (default: 2%)
• For LONG positions: Entry Price × (1 - Stop Loss %)
• For SHORT positions: Entry Price × (1 + Stop Loss %)
• Displayed as a RED horizontal line
• Can be disabled by setting to 0
Take Profit Levels (3 Targets):
The system automatically calculates three progressive take profit levels based on risk-reward ratios:
TP1 (1:1 Risk-Reward):
• For LONG: Entry × (1 + Stop Loss %)
• For SHORT: Entry × (1 - Stop Loss %)
• Exit 33% of the position
TP2 (2:1 Risk-Reward):
• For LONG: Entry × (1 + Stop Loss % × 2)
• For SHORT: Entry × (1 - Stop Loss % × 2)
• Exit another 33% of the position
TP3 (3:1 Risk-Reward):
• For LONG: Entry × (1 + Stop Loss % × 3)
• For SHORT: Entry × (1 - Stop Loss % × 3)
• Exit final 33% of the position
All levels are displayed as GREEN horizontal lines with labels showing the exact price.
Example:
If you buy at $100 with a 2% stop loss:
• Stop Loss: $98 (2% below entry)
• TP1: $102 (2% above entry, 1:1 ratio)
• TP2: $104 (4% above entry, 2:1 ratio)
• TP3: $106 (6% above entry, 3:1 ratio)
Position Management:
The indicator automatically closes the position if:
• Price hits stop loss
• Price reaches TP3
• An opposite signal is generated
COMPONENT 5: MACD CLOUD VISUALIZATION
The indicator includes a visual cloud between two EMA lines that changes colour based on MACD conditions.
Cloud Construction:
• Upper Band: 10-period EMA of high prices
• Lower Band: 10-period EMA of low prices
• MACD: Standard 12/26/9 MACD calculation
Cloud Colour Coding:
🟦 Aqua Cloud - MACD positive and rising (strong uptrend)
🟦 Aqua Cloud (faded) - MACD positive but falling (weakening uptrend)
🟥 Red Cloud - MACD negative and falling (strong downtrend)
🟥 Red Cloud (faded) - MACD negative but rising (weakening downtrend)
Purpose:
The cloud provides a quick visual reference for overall market momentum and trend strength. When the cloud aligns with the signal direction, it adds confirmation to the trade.
COMPONENT 6: SUPPORT & RESISTANCE LEVELS
─────────────────────────────────────────────────────────────────────────────
The indicator automatically identifies and plots key support and resistance levels.
Support Level (Green Line):
• Calculated as the lowest close over the last 20 periods (customizable)
• Represents the price floor where buying interest has historically emerged
• Acts as a potential bounce point or breakdown level
Resistance Level (Red Line):
• Calculated as the highest close over the last 20 periods (customizable)
• Represents the price ceiling where selling pressure has historically emerged
• Acts as a potential rejection point or breakout level
How to Use:
• Buy signals near support levels have a higher probability
• Sell signals near resistance levels have a higher probability
• Breakouts above resistance or below support can lead to extended moves
• These levels help with additional confirmation and exit planning
COMPONENT 7: SUPPLY & DEMAND ZONES
The indicator identifies and visualises institutional supply and demand zones using transparent boxes.
Demand Zone (Green Box):
• Triggered when price crosses above the 50-period lowest close
• Zone spans from the lowest close to the lowest high in that period
• Represents an area where buyers are overwhelmed by sellers
• Often acts as support on retests
Supply Zone (Red Box):
• Triggered when price crosses below the 50-period highest close
• Zone spans from the highest low to the highest close in that period
• Represents an area where sellers are overwhelmed by buyers
• Often acts as resistance on retests
Visual Representation:
• Boxes extend forward from the point of creation
• Length: 50 bars (matches the lookback period)
• Transparency: 90% to avoid chart clutter
• Fresh zones appear as price action creates them
Trading Application:
• Buy signals occurring in or near demand zones have a higher probability
• Sell signals occurring in or near supply zones have a higher probability
• Watch for price reactions when revisiting these zones
• Strong trends often create multiple zones in sequence
SIGNAL VISUALIZATION & ALERTS
SIGNAL VISUALIZATION
The indicator provides clear, unambiguous visual signals directly on the price chart.
BUY SIGNALS:
• 🟢 Small teal circle below the bar (trend change marker)
• 🟢 Teal "Buy" label below the bar (when "Show Buy/Sell Signals" is enabled)
• Appears when all buy conditions are met
• Entry line, stop loss, and three take profit levels automatically plotted
SELL SIGNALS:
• 🔴 Small red circle above the bar (trend change marker)
• 🔴 Red "Sell" label above the bar (when "Show Buy/Sell Signals" is enabled)
• Appears when all sell conditions are met
• Entry line, stop loss, and three take profit levels automatically plotted
ACTIVE POSITION DISPLAY:
When a position is active (not yet closed), the indicator shows:
• Entry price line (blue for long, purple for short)
• Stop loss line (red)
• Three take profit lines (all green)
• Labels on the right showing exact prices
• All lines extend from the entry bar to the current bar
ALERT SYSTEM
The B+S System includes a sophisticated alert mechanism that sends detailed notifications.
Alert Triggers:
• Buy Signal Alert - Fires when all buy conditions align
• Sell Signal Alert - Fires when all sell conditions align
• Frequency: Once per bar close (prevents false alerts on wicks)
Alert Content:
Each alert includes complete trade information:
• Signal type (Buy or Sell)
• Entry price
• All three take profit levels
• Stop loss price
• Symbol/ticker name
Example Alert Message:
"Buy signal triggered on [CPtrading369]! Entry Price: 100.50, Take Profit 1: 102.51, Take Profit 2: 104.52, Take Profit 3: 106.53, Stop Loss: 98.49"
Setting Up Alerts:
1. Click "Create Alert" in TradingView
2. Select "B+S - Sys by Veldora" as the condition
3. Choose "Buy Signal" or "Sell Signal"
4. Configure notification method (email, SMS, webhook, popup)
5. Set an alert to trigger "Once Per Bar Close"
TRADING WITH THE B+S SYSTEM
RECOMMENDED WORKFLOW
Step 1: Wait for the signal
• Monitor your chart for buy or sell signals
• Signals appear as labelled shapes with entry lines
Step 2: Evaluate Context
Before taking the trade, check:
• Is the price near a support/resistance level?
• Is the price in a supply/demand zone?
• Does MACD cloud colour align with signal direction?
• Are moving averages in proper order?
• Is VWAP confirming the bias?
Step 3: Enter Position
• Enter at the marked entry price
• Set stop loss at the red line level
• Set three take profit orders at the green line levels
Step 4: Manage Position
• Exit 1/3 at TP1 (lock in 1:1)
• Exit 1/3 at TP2 (lock in 2:1)
• Exit 1/3 at TP3 (lock in 3:1)
• Alternatively, exit entire position at TP1 for a conservative approach
• Always honour stop loss—no exceptions
Step 5: Close on Opposite Signal (Optional)
• If an opposite signal appears before TP3, consider exiting
• This prevents giving back profits in choppy markets
TIMEFRAME RECOMMENDATIONS
Scalping (High Frequency):
• 1-minute to 5-minute charts
• Reduce sensitivity to 1.0-1.5 for more signals
• Use tighter stop loss (1.0-1.5%)
• Focus on TP1 and TP2
Day Trading:
• 15-minute to 1-hour charts
• Default sensitivity (2.0) works well
• Default stop loss (2.0%) is appropriate
• Target all three TPs
Swing Trading:
• 4-hour to daily charts
• Increase sensitivity to 2.5-3.0 for quality signals
• Increase stop loss to 3-5% for breathing room
• Hold for all three TPs, position trades for days/weeks
Position Trading:
• Daily to weekly charts
• High sensitivity (3.5-5.0)
• Larger stop loss (5-10%)
• Patient approach, targeting extended moves
MARKET CONDITIONS
Best Performance:
• Trending markets (strong directional moves)
• Clear support/resistance structure
• Markets with healthy volatility
Challenging Conditions:
• Tight consolidation ranges
• Extremely low volatility
• News-driven whipsaw events
Adaptation Strategies:
• In choppy markets: Increase sensitivity to reduce signals
• In volatile markets: Increase stop loss percentage
• During consolidation: Wait for breakout signals near S/R levels
POSITION SIZING RECOMMENDATIONS
The indicator shows exact entry and stop loss prices, making position sizing straightforward:
Risk Per Trade = Account Size × Risk Percentage
Position Size = Risk Per Trade ÷ (Entry Price - Stop Loss Price)
Example:
• Account: $10,000
• Risk: 2% per trade = $200
• Entry: $100
• Stop Loss: $98
• Distance: $2
• Position Size: $200 ÷ $2 = 100 shares
This ensures you never risk more than your predetermined percentage, regardless of stop loss distance.
OPTIMIZATION GUIDE
TUNING FOR YOUR STYLE
For More Signals (Aggressive):
• Decrease Sensitivity to 1.0-1.5
• Decrease ATR Length to 7-10
• Use shorter MA lengths (10/21/50)
• Accept more risk for more opportunities
For Fewer, Higher-Quality Signals (Conservative):
• Increase Sensitivity to 3.0-5.0
• Increase ATR Length to 20-30
• Use longer MA lengths (50/100/200)
• Prioritise quality over quantity
For Shorter Holding Periods:
• Tighter stop loss (1.0-1.5%)
• Focus on TP1 and TP2
• Faster moving averages
• Lower timeframes
For Longer Holding Periods:
• Wider stop loss (3-5%)
• Target all three TPs
• Slower moving averages
• Higher timeframes
BACKTESTING RECOMMENDATIONS
1. Test on Historical Data
• Run the indicator on 6-12 months of past data
• Evaluate signal quality and frequency
• Note win rate and average risk-reward
2. Optimise Parameters
• Test different sensitivity values
• Experiment with stop loss percentages
• Try various MA combinations
3. Forward Test
• Apply optimised settings to recent data (not used in optimisation)
• Verify performance holds up
• Avoid overfitting to historical conditions
4. Paper Trade
• Use TradingView's paper trading or demo account
• Follow signals in real-time without risking capital
• Build confidence and familiarity
5. Start Small
• Begin with minimum position sizes
• Gradually increase as you gain experience
• Never risk more than you can afford to lose
ADVANCED TECHNIQUES
COMBINING WITH OTHER ANALYSES
Fibonacci Retracements:
• Use B+S signals that occur at 50% or 61.8% retracement levels
• These often represent high-probability reversal points
• Combine with supply/demand zones for additional confirmation
Chart Patterns:
• Watch for B+S signals at pattern completion points
• Double bottoms/tops, head and shoulders, triangles
• Signal confirms the pattern break
Volume Analysis:
• Stronger signals occur with above-average volume
• Watch for volume spikes at signal points
• VWAP provides volume-weighted context
Multiple Timeframe Confirmation:
• Check the higher timeframe trend before taking the signal
• Best signals align with daily/weekly trend
• Use a lower timeframe for precise entry
PARTIAL PROFIT TAKING STRATEGIES
Standard Approach (Recommended):
• Exit 33% at TP1 (secures 1:1)
• Exit 33% at TP2 (captures 2:1)
• Exit 33% at TP3 (captures 3:1)
Conservative Approach:
• Exit 50% at TP1 (locks in profit quickly)
• Exit 25% at TP2
• Exit 25% at TP3 or trail stop
Aggressive Approach:
• Exit 20% at TP1
• Exit 30% at TP2
• Exit 50% at TP3 (maximize winners)
Runner Strategy:
• Exit 50% at TP1
• Move stop to breakeven
• Trail remaining 50% using ATR or support/resistance
INDICATOR COMPONENTS REFERENCE
VISUAL ELEMENTS ON CHART
🔵 VWAP | Blue line, 14-period volume-weighted average
🔴 MA1 | Red line, default 20 SMA
🟢 MA2 | Green line, default 50 EMA
🟣 MA3 | Purple line, default 100 TEMA
🟦 MACD Cloud | Aqua/red cloud showing momentum
🟢 Support Line | Green horizontal line
🔴 Resistance Line | Red horizontal line
🟩 Demand Zone | Green transparent box
🟥 Supply Zone | Red transparent box
🟢 Buy Signal | Teal circle + "Buy" label
🔴 Sell Signal | Red circle + "Sell" label
🔵 Entry Price | Blue/purple horizontal line
🔴 Stop Loss | Red horizontal line with label
🟢 Take Profit 1-3 | Three green horizontal lines with labels
TECHNICAL INDICATORS USED
ATR | Volatility measurement for dynamic bands
RSI | Momentum oscillator (9-period)
CMO | Chande Momentum Oscillator (custom calc)
HMA | Hull Moving Average (for smoothing)
MACD | Moving Average Convergence Divergence (12/26/9)
EMA | Exponential Moving Average (various lengths)
TEMA | Triple Exponential Moving Average
Pivot Points | Swing high/low detection
TECHNICAL SPECIFICATIONS
Platform: TradingView
Language: Pine Script Version 5
Indicator Type: Overlay (plots on price chart)
Signals: Both long and short
Repainting: No (signals fixed at bar close)
Alerts: Yes (detailed alerts with entry/TP/SL prices)
Customisation: Highly configurable with 15+ parameters
Visual Elements: Lines, labels, shapes, clouds, boxes
Resource Usage: Moderate (efficient code)
BEST PRACTICES SUMMARY
✓ ALWAYS wait for bar close before entering—don't jump on wicks
✓ ALWAYS honour your stop loss—it's there to protect you
✓ BACKTEST your settings on the instrument and timeframe you'll trade
✓ START with default parameters, then optimise gradually
✓ USE higher timeframes for trend context before taking lower timeframe signals
✓ COMBINE signals with support/resistance and supply/demand zones
✓ SCALE into positions by taking partial profits at each TP level
✓ KEEP a trading journal tracking which setups work best
✓ AVOID taking signals during major news events
✓ RESPECT the indicator—it's a tool, not a crystal ball
INDICATOR PHILOSOPHY
The B+S System by Veldora is designed around a core principle: **context matters more than signals**.
Rather than generating signals at every price fluctuation, the indicator waits for multiple independent confirmations to align. When trend direction, momentum, oscillator readings, and pivot structure all agree, the probability of success increases dramatically.
The automatic calculation of three take profit levels and a protective stop loss removes emotion from trade management. You know your risk, your potential reward, and your exit plan before you even enter the position.
This is a complete trading system in indicator form—providing not just signals, but a framework for consistent, disciplined trading with clearly defined risk parameters.
Whether you're a scalper looking for quick moves, a day trader seeking intraday swings, or a position trader targeting multi-day trends, the B+S System adapts to your style through its comprehensive parameter controls.
Trade smart. Trade with confluence. Trade with the B+S System.
FREQUENTLY ASKED QUESTIONS
Q: Why am I not getting any signals?
A: The indicator requires multiple conditions to align (trend, RSI, CMO, pivots). Try decreasing sensitivity or using a lower timeframe for more frequent signals.
Q: Should I take every signal?
A: No. Filter signals based on context: proximity to S/R levels, alignment with higher timeframe trend, MACD cloud colour, and MA positioning.
Q: Can I change the risk-reward ratio?
A: The 1:1, 2:1, and 3:1 ratios are hardcoded based on stop loss percentage. To change, modify the stop loss percentage—TPs will adjust proportionally.
Q: What's the difference between the two ATR methods?
A: Method 1 uses exponential smoothing (standard ATR), Method 2 uses simple moving average. Method 1 is generally more responsive.
Q: How do I avoid whipsaws?
A: Increase sensitivity (2.5-3.5), wait for signals at key levels, confirm with MACD cloud, and consider higher timeframes.
Q: Do signals repaint?
A: No. Signals are generated at bar close and remain fixed. The "alert.freq_once_per_bar_close" ensures alerts only fire after bar completion.
Q: What's the best stop loss percentage?
A: Depends on the timeframe and volatility. Lower timeframes: 1-2%. Higher timeframes: 2-5%. Test different values via backtest.
Q: Should I use all three MAs?
A: The MAs are optional visual aids. The signal logic doesn't depend on them—they're for trend context and confluence.
Q: Can I use this for crypto/forex/stocks?
A: Yes. The indicator works on any market. Adjust parameters for the specific instrument's volatility and timeframe.
Q: How do I set up webhook alerts?
A: In TradingView alert settings, enable webhook URL and paste your automation service URL. Alerts will trigger your bots.
Questions? Need support? Want to share your results?
Contact us and Happy Trading!
DISCLAIMER:
These indicators are provided for educational and informational purposes only. It is not financial advice and should not be construed as a recommendation to buy or sell any financial instrument. Trading involves substantial risk of loss and is not suitable for all investors. Past performance of the indicator does not guarantee future results.
Always conduct your own research and testing before trading with real capital. Consider your financial situation, risk tolerance, and trading experience before using this or any trading indicator. Consult with a licensed financial advisor if you have questions about trading or investing.
The creator of this indicator makes no warranties or guarantees regarding its accuracy, performance, or profitability. You are solely responsible for your trading decisions and their outcomes.
Add comment
Comments