

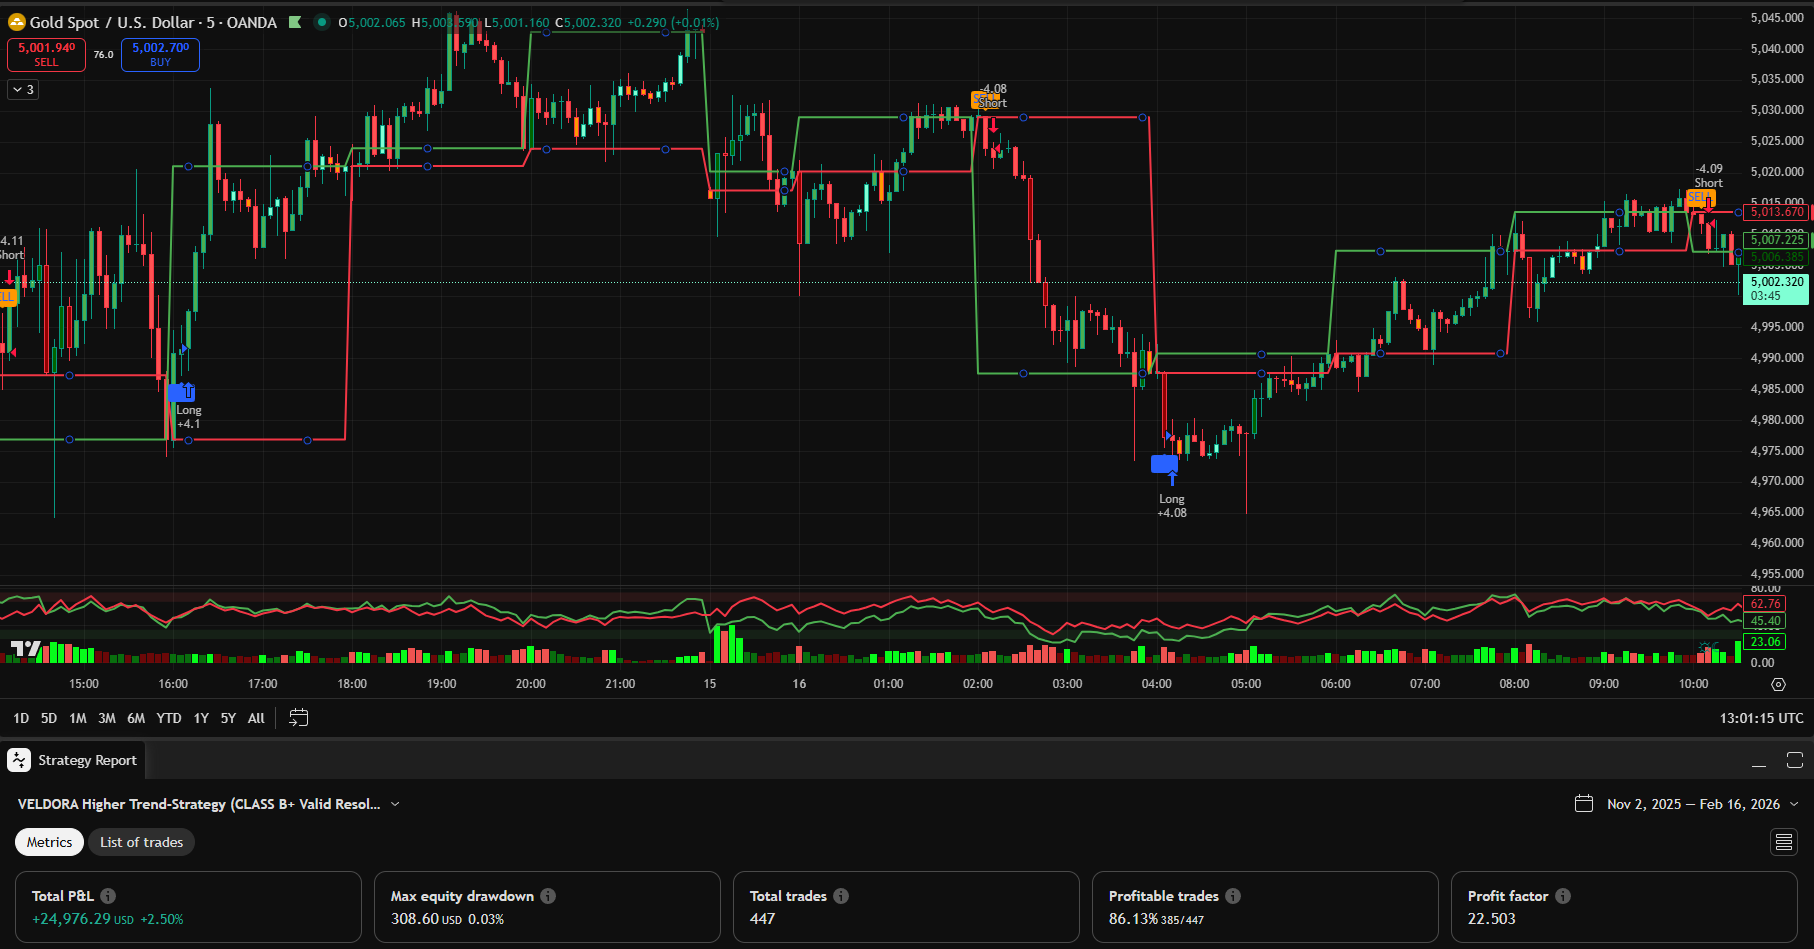
VELDORA Higher Trend-Strategy (CLASS B+ Valid Resolutions)
Multi-Timeframe Crossover Strategy with Advanced Risk Management
Click the images to enlarge
OVERVIEW
The VELDORA Higher Trend-Strategy is a sophisticated multi-timeframe trading system that leverages the power of higher timeframe analysis to identify high-probability trend reversals on lower timeframe charts. By analysing price action on a user-selected higher timeframe while executing trades on the current chart timeframe, this strategy filters out market noise and focuses on significant directional moves.
The strategy is built around a simple yet powerful concept: when the close price crosses above the open price on a higher timeframe, it signals bullish momentum; when it crosses below, it signals bearish momentum. This crossover approach, combined with comprehensive risk management features, creates a complete trading system suitable for both discretionary and automated trading.
KEY FEATURES
✓ Multi-Timeframe Analysis - Analyses higher timeframes while trading on the current chart
✓ Valid Resolution System - Pre-validated timeframes ensure reliable data
✓ Custom Resolution Mapping - Automatically maps custom inputs to the nearest valid timeframe
✓ Open-Closed Crossover Logic - Simple, robust signal generation
✓ Percentage-Based Risk Management - Customizable stop loss and take profit
✓ Dynamic Position Sizing - Risk-based position calculation
✓ Optional Trailing Stop - Lock in profits as trades move in your favour
✓ Both Long and Short - Complete bidirectional trading capability
✓ Clean Visual Signals - Clear BUY/SELL labels onthe chart
✓ Fully Automated - Set it and let it trade based on your parameters
#trading #strategy #ustomstrategies #tradingstrategies
HOW THE STRATEGY WORKS
CORE CONCEPT: HIGHER TIMEFRAME ANALYSIS
The fundamental principle behind this strategy is that higher timeframe price action carries more weight than lower timeframe fluctuations. A 4-hour candle closing above its open is more significant than a 5-minute candle doing the same thing.
The Problem with Single Timeframe Trading:
When you trade solely on your chart's timeframe, you're exposed to:
• Market noise and false signals
• Whipsaws in choppy conditions
• Counter-trend moves that fail quickly
• Lack of "big picture" perspective
The Multi-Timeframe Solution:
By referencing a higher timeframe for signal generation while executing on the current timeframe, you get:
• Fewer but higher-quality signals
• Better alignment with dominant trends
• Reduced false breakouts
• Improved risk-reward ratios
THE SIGNAL GENERATION MECHANISM
The strategy monitors two key data points from your selected higher timeframe:
1. **Open Price** - The opening price of the higher timeframe candle
2. **Close Price** - The closing price of the higher timeframe candle
Signal Logic:
LONG (BUY) SIGNAL:
Triggers when the higher timeframe close crosses ABOVE the higher timeframe open
• Indicates bullish momentum on the higher timeframe
• Suggests buyers are gaining control
• The previous candle closed below its open, and the current candle is closing above
• Represents a shift from bearish to bullish sentiment
SHORT (SELL) SIGNAL:
Triggers when the higher timeframe close crosses BELOW the higher timeframe open
• Indicates bearish momentum on the higher timeframe
• Suggests sellers are gaining control
• The previous candle closed above its open, and the current candle is closing below
• Represents a shift from bullish to bearish sentiment
Important Technical Detail:
The strategy uses `out2[1]` and `out1[1]`, which means it looks at the PREVIOUS higher timeframe bar for crossovers. This ensures signals are based on completed candles, not in-progress price action, reducing false signals.
LOOKAHEAD SETTING EXPLAINED
The strategy uses `lookahead=barmerge.lookahead_on` in its security calls. This is a critical technical setting that deserves explanation.
What Lookahead Does:
• Mimics Pine Script v2 behaviour
• Ensures consistency in how higher timeframe data is accessed
• Prevents repainting issues in certain scenarios
• Aligns higher timeframe data properly with current timeframe bars
When you request higher timeframe data, TradingView needs to decide which higher timeframe bar to use for each lower timeframe bar. The lookahead setting controls this mapping behaviour.
For This Strategy:
The lookahead setting ensures that when you're trading on, say, a 15-minute chart while analysing a 4-hour timeframe, each 15-minute bar references the correct 4-hour candle data consistently.
RESOLUTION SYSTEM
VALID RESOLUTIONS (CLASS B+)
The strategy includes a curated list of "valid resolutions" that work reliably across all instruments and market conditions:
Available Timeframes:
• 1 minute - Ultra-short-term scalping
• 5 minutes - Short-term scalping
• 15 minutes - Active intraday trading
• 30 minutes - Moderate intraday trading
• 60 minutes (1 hour) - Standard intraday
• 120 minutes (2 hours) - Extended intraday
• 240 minutes (4 hours) - Swing trading transition
• 1D (Daily) - Swing and position trading
• 1W (Weekly) - Long-term position trading
Why These Specific Timeframes?
These resolutions are "Class B+ Valid" because:
1. They're supported universally across all TradingView instruments
2. They provide sufficient data density for reliable signals
3. They align with common trading session structures
4. They avoid exotic timeframes that may have data gaps
CUSTOM RESOLUTION FEATURE
For advanced users who want a specific timeframe not in the standard list, the strategy includes a custom resolution feature with intelligent mapping.
How It Works:
1. Enable "Use Custom Resolution"
2. Enter your desired timeframe in minutes (e.g., 90 for 1.5 hours)
3. Strategy automatically maps to the nearest valid resolution
Mapping Logic:
Input Range → Maps To
1 minute or less → 1 minute
2-5 minutes → 5 minutes
6-15 minutes → 15 minutes
16-30 minutes → 30 minutes
31-60 minutes → 60 minutes (1 hour)
61-120 minutes → 120 minutes (2 hours)
121-240 minutes → 240 minutes (4 hours)
241+ minutes → 1D (Daily)
Example:
If you input 90 minutes, the strategy uses 120 minutes (2 hours)
If you input 45 minutes, the strategy uses 60 minutes (1 hour)
Why Mapping?
This ensures you always use a timeframe with reliable data, even if you request an unconventional period. The mapping algorithm selects the closest standardised timeframe, preventing data gaps or inconsistencies.
CHOOSING THE RIGHT RESOLUTION
General Guidelines:
Chart Timeframe Best Higher Timeframe Trading Style
1-minute chart → 15 or 30 minutes Scalping
5-minute chart → 30 or 60 minutes Active day trading
15-minute chart → 120 or 240 minutes Day trading
30-minute chart → 240 minutes or Daily Swing trading
1-hour chart → Daily Swing trading
4-hour chart → Daily or Weekly Position trading
Daily chart → Weekly Long-term investing
Rule of Thumb:
Choose a higher timeframe that is 4-8 times larger than your chart timeframe. For example:
• Trading on 15-minute chart → Use 60-minute (4x) or 120-minute (8x) resolution
• Trading on 1-hour chart → Use 4-hour (4x) or Daily (~24x) resolution
This ratio ensures you're capturing meaningful higher timeframe trends without being too far removed from your execution timeframe.
RISK MANAGEMENT SYSTEM
The strategy includes comprehensive risk management features that can be customised to your risk tolerance and trading style.
STOP LOSS
Type: Percentage-based
Default: 2.0%
Range: 0.1% and up
How It Works:
For LONG positions:
• Stop Loss = Entry Price × (1 - Stop Loss %)
• Example: Buy at $100 with 2% SL → Stop at $98
For SHORT positions:
• Stop Loss = Entry Price × (1 + Stop Loss %)
• Example: Sell at $100 with 2% SL → Stop at $102
Purpose:
The stop loss limits your maximum loss on any single trade. If the price moves against you by the specified percentage, the position automatically closes, preserving capital.
Recommended Settings:
• Scalping (1-5 min charts): 0.5-1.0%
• Day Trading (15-60 min charts): 1.0-2.0%
• Swing Trading (4H-Daily charts): 2.0-5.0%
• Position Trading (Daily-Weekly): 5.0-10.0%
Higher timeframes generally require wider stops to avoid getting stopped out by normal volatility.
TAKE PROFIT
Type: Percentage-based
Default: 5.0%
Range: 0.1% and up
How It Works:
For LONG positions:
• Take Profit = Entry Price × (1 + Take Profit %)
• Example: Buy at $100 with 5% TP → Exit at $105
For SHORT positions:
• Take Profit = Entry Price × (1 - Take Profit %)
• Example: Sell at $100 with 5% TP → Exit at $95
Purpose:
Automatically locks in profits when the price reaches your target level. Removes emotion from profit-taking decisions.
Risk-Reward Ratio:
With default settings (2% SL, 5% TP), your risk-reward ratio is:
• Risk: 2%
• Reward: 5%
• Ratio: 1:2.5
This means you can be profitable even with a 40% win rate:
• 40 wins × 5% = +200%
• 60 losses × 2% = -120%
• Net: +80%
Recommended Risk-Reward Ratios:
• Minimum: 1:1.5 (3% TP with 2% SL)
• Conservative: 1:2 (4% TP with 2% SL)
• Balanced: 1:2.5 (5% TP with 2% SL) ← Default
• Aggressive: 1:3+ (6%+ TP with 2% SL)
POSITION SIZING (RISK PER TRADE)
Type: Percentage of equity
Default: 1.0%
Range: 0.1% and up
How It Works:
The strategy dynamically calculates position size based on your account equity and risk tolerance:
Position Size = (Account Equity × Risk Per Trade %) / Current Price
Example 1: Conservative
• Account: $10,000
• Risk Per Trade: 1%
• Risk Amount: $100
• Current Price: $50
• Position Size: $100 / $50 = 2 shares
Example 2: Moderate
• Account: $10,000
• Risk Per Trade: 2%
• Risk Amount: $200
• Current Price: $50
• Position Size: $200 / $50 = 4 shares
Example 3: Aggressive
• Account: $10,000
• Risk Per Trade: 5%
• Risk Amount: $500
• Current Price: $50
• Position Size: $500 / $50 = 10 shares
Important Note:
This parameter controls how much of your TOTAL account you risk per trade, not just the position size. With proper stop loss placement, your actual risk is limited to the stop loss percentage.
Recommended Settings:
• Conservative: 0.5-1.0% (can withstand 100+ losing trades)
• Moderate: 1.0-2.0% (can withstand 50+ losing trades)
• Aggressive: 2.0-5.0% (can withstand 20+ losing trades)
• Very Aggressive: 5.0-10.0% (risk of significant drawdowns)
Most professional traders use 1-2% risk per trade for long-term consistency.
TRAILING STOP (OPTIONAL)
Type: Optional trailing stop
Default: Disabled
Trailing Offset: 1.0% (when enabled)
How It Works:
When enabled, the trailing stop "follows" the price as it moves in your favour, locking in profits while still allowing the trade to run.
For LONG positions:
• Initial stop set at entry price minus stop loss %
• As price rises, stop rises with it, maintaining the trailing offset
• Stop never moves down, only up
• If price reverses by the trailing offset %, position closes
For SHORT positions:
• Initial stop set at entry price plus stop loss %
• As price falls, stop falls with it, maintaining the trailing offset
• Stop never moves up, only down
• If price reverses by the trailing offset %, position closes
Example (Long Trade):
• Entry: $100
• Initial Stop: $98 (2% stop loss)
• Trailing enabled with 1% offset
• Price rises to $110
• New stop: $108.90 (1% below $110)
• Price rises to $115
• New stop: $113.85 (1% below $115)
• Price falls to $113.85 → Trade exits with $13.85 profit (13.85%)
When to Use Trailing Stops:
✓ In strong trending markets
✓ For capturing extended moves
✓ When you want to "let profits run"
✓ For overnight/multi-day positions
When NOT to Use Trailing Stops:
✗ In choppy, ranging markets (may get stopped out prematurely)
✗ For quick scalp trades with fixed targets
✗ When you prefer defined risk-reward ratios
STRATEGY EXECUTION
ENTRY LOGIC
LONG ENTRY:
When: Higher timeframe close crosses above higher timeframe open (on previous bar)
Action:
1. Enter long position with calculated position size
2. Set stop loss at entry price - stop loss %
3. Set take profit at entry price + take profit %
4. If trailing stop is enabled, activate the trailing mechanism
5. Display blue "BUY" label below the bar
SHORT ENTRY:
When: Higher timeframe close crosses below higher timeframe open (on previous bar)
Action:
1. Enter a short position with a calculated position size
2. Set stop loss at entry price + stop loss %
3. Set take profit at entry price - take profit %
4. If trailing stop is enabled, activate the trailing mechanism
5. Display orange "SELL" label above the bar
EXIT LOGIC
Positions exit under four conditions:
1. Take Profit Hit:
• Price reaches your profit target
• Position closes with predetermined profit
• Most desirable outcome
2. Stop Loss Hit:
• Price moves against you by stop loss percentage
• Position closes with predetermined loss
• Protects capital from larger losses
3. Trailing Stop Triggered (if enabled):
• Price reverses by trailing offset amount
• Locks in profits after a favourable move
• Allows capture of extended trends
4. Opposite Signal:
• A new signal in the opposite direction appears
• Current position closes
• New position opens in the opposite direction
• Allows strategy to reverse quickly with market sentiment
VISUAL SIGNALS ON CHART
The strategy provides clear visual feedback:
📊 Red Line - Open price of higher timeframe
📊 Green Line - Close price of higher timeframe
🔵 Blue "BUY" Label - Long entry signal (below bar)
🟠 Orange "SELL" Label - Short entry signal (above bar)
The red and green lines help you visually understand the relationship between open and close on the higher timeframe, making it easy to see why signals are generated.
PRACTICAL TRADING EXAMPLES
EXAMPLE 1: INTRADAY SCALPING
Setup:
• Chart Timeframe: 5 minutes
• Higher Resolution: 30 minutes
• Stop Loss: 0.8%
• Take Profit: 1.5%
• Risk Per Trade: 1%
• Trailing Stop: Disabled
Scenario:
You're trading the 5-minute chart on a liquid stock. At 10:00 AM, a new 30-minute candle closes above its open, triggering a long signal on your 5-minute chart.
Trade Execution:
• Entry: $100.00
• Stop Loss: $99.20 (0.8% below entry)
• Take Profit: $101.50 (1.5% above entry)
• Position Size: $10,000 account × 1% = $100 risk / $100 = 1 share
Outcome:
Price rises steadily and hits your take profit at $101.50 within the next hour.
• Profit: $1.50 per share
• Return: 1.5%
• Account Impact: +$1.50
EXAMPLE 2: SWING TRADING
Setup:
• Chart Timeframe: 1 hour
• Higher Resolution: Daily (1D)
• Stop Loss: 3.0%
• Take Profit: 9.0%
• Risk Per Trade: 2%
• Trailing Stop: Enabled (1.5% offset)
Scenario:
You're swing trading a cryptocurrency. Today's daily candle closes above its open for the first time in a week, generating a long signal on your hourly chart.
Trade Execution:
• Entry: $5,000
• Initial Stop Loss: $4,850 (3% below entry)
• Take Profit: $5,450 (9% above entry)
• Position Size: $50,000 account × 2% = $1,000 risk / $5,000 = 0.2 coins
Outcome:
Price rises to $5,600 over the next 3 days. Your trailing stop (1.5% offset) is now at $5,516.
Price then reverses and hits your trailing stop.
• Exit: $5,516
• Profit: $516 per coin × 0.2 = $103.20
• Return: 10.32%
• Account Impact: +$103.20 (vs. potential $90 if you hit fixed TP)
The trailing stop captured an extra 1.32% beyond your fixed take profit target.
EXAMPLE 3: POSITION TRADING
• Chart Timeframe: Daily
• Higher Resolution: Weekly (1W)
• Stop Loss: 8.0%
• Take Profit: 24.0%
• Risk Per Trade: 1%
• Trailing Stop: Enabled (3% offset)
Scenario:
You're position trading an index ETF. This week's weekly candle closes above its open, signalling a potential multi-week uptrend.
Trade Execution:
• Entry: $300
• Initial Stop Loss: $276 (8% below entry)
• Take Profit: $372 (24% above entry)
• Position Size: $100,000 account × 1% = $1,000 risk / $300 = 3.33 shares
Outcome:
Over the next 6 weeks, the price climbs steadily to $380. Trailing stop is now at $368.60 (3% below $380).
Price consolidates and reverses, hitting the trailing stop.
• Exit: $368.60
• Profit: $68.60 per share × 3.33 = $228.44
• Return: 22.87%
• Account Impact: +$228.44
Even though the price didn't reach your 24% take profit, the trailing stop secured a 22.87% gain.
OPTIMIZATION GUIDE
FINDING YOUR OPTIMAL SETTINGS
Step 1: Choose Your Trading Style
Define your approach first:
• Scalping: Many quick trades, small profits
• Day Trading: 2-10 trades per day, intraday only
• Swing Trading: Multi-day positions, 2-10 per month
• Position Trading: Multi-week positions, 1-5 per month
Step 2: Select Timeframes
Match your chart and higher resolution to your style:
Scalping:
• Chart: 1-5 minutes
• Higher: 15-30 minutes
Day Trading:
• Chart: 5-15 minutes
• Higher: 60-240 minutes
Swing Trading:
• Chart: 15 minutes - 1 hour
• Higher: 240 minutes - Daily
Position Trading:
• Chart: 1 hour - Daily
• Higher: Daily - Weekly
Step 3: Set Risk Parameters
Start with these baseline settings and adjust:
Conservative:
• Stop Loss: 2-3%
• Take Profit: 6-9% (3:1 ratio)
• Risk Per Trade: 0.5-1%
• Trailing Stop: Enabled
Moderate (Default):
• Stop Loss: 2%
• Take Profit: 5% (2.5:1 ratio)
• Risk Per Trade: 1-2%
• Trailing Stop: Optional
Aggressive:
• Stop Loss: 1.5%
• Take Profit: 3% (2:1 ratio)
• Risk Per Trade: 2-5%
• Trailing Stop: Disabled (fixed targets)
Step 4: Backtest
Use TradingView's Strategy Tester to evaluate:
• Net Profit
• Win Rate
• Profit Factor
• Maximum Drawdown
• Average Trade Duration
• Number of Trades
Aim for:
• Win Rate: 45-60% (with good risk-reward)
• Profit Factor: > 1.5
• Max Drawdown: < 20%
Step 5: Forward Test
Test your optimised settings on recent data you didn't use for optimisation. If performance drops significantly, you've overfitted.
Step 6: Paper Trade
Run the strategy in TradingView's paper trading or a demo account for 20-50 signals before risking real capital.
COMMON OPTIMIZATION MISTAKES
❌ Optimising for maximum profit instead of consistency
✓ Optimise for stable, repeatable performance
❌ Using too many parameters
✓ This strategy has just 5 main parameters—keep it simple
❌ Testing on the same data you optimise on
✓ Always validate on out-of-sample data
❌ Optimising for 100% win rate
✓ Accept losses as part of the system; focus on positive expectancy
❌ Changing settings after a few losing trades
✓ Give strategies time to prove themselves (100+ trades minimum)
MARKET CONDITIONS & PERFORMANCE
BEST PERFORMING CONDITIONS
Strong Trending Markets:
• Clear directional moves on a higher timeframe
• Crossovers align with established trends
• Take profit targets frequently hit
• Trailing stops capture extended moves
Volatility Expansion:
• Market transitioning from consolidation to trend
• Higher timeframe candles show decisive closes
• Good momentum behind moves
• Stops are rarely hit due to directional clarity
Post-News Events:
• After major announcements settle
• New trends are established on higher timeframes
• Signals mark the beginning of sustained moves
CHALLENGING CONDITIONS
Tight Ranging Markets:
• Higher timeframe opens and closes very similarly
• Frequent crossovers in both directions
• Whipsaw trades
• Signals lack follow-through
Low Volatility:
• Small price movements
• Profit targets difficult to reach
• Risk-reward ratios deteriorate
• Many breakeven or small loss trades
News-Driven Whipsaws:
• Sudden reversals around economic data releases
• Gap openings that invalidate signals
• Unpredictable volatility spikes
ADAPTATION STRATEGIES
For Choppy Markets:
• Increase higher timeframe resolution (e.g., from 60 to 240 minutes)
• Widen stop loss to avoid premature exits
• Reduce risk per trade (0.5-1%)
• Consider trading less frequently
For Trending Markets:
• Enable trailing stops to capture extended moves
• Tighten stop loss once in profit
• Consider pyramiding into positions (manual intervention)
For High Volatility:
• Increase stop loss percentage to match volatility
• Reduce position size to maintain consistent dollar risk
• Consider using ATR-based stops (requires code modification)
ADVANCED USAGE TIPS
COMBINING WITH OTHER ANALYSES
Support and Resistance:
• Take signals that occur near major S/R levels
• Better entries at support (for longs) or resistance (for shorts)
• Avoid signals in the middle of large ranges
Trend Indicators:
• Confirm higher timeframe trend with additional moving averages
• Only take long signals when the price is above the 200-period MA
• Only take short signals when the price is below the 200-period MA
Volume Analysis:
• Stronger signals occur with above-average volume
• Use volume confirmation for additional filtering
• Watch for volume climax at reversal points
Chart Patterns:
• Signals that align with pattern completions
• Double bottoms/tops, flags, triangles
• Higher probability when technical patterns confirm
MULTIPLE TIMEFRAME STACKING
Advanced traders can run multiple instances of the strategy with different resolutions:
Configuration 1: Scalping Layer
• Chart: 5 minutes
• Higher: 15 minutes
• Aggressive settings
Configuration 2: Day Trading Layer
• Chart: 15 minutes
• Higher: 60 minutes
• Moderate settings
Configuration 3: Swing Layer
• Chart: 1 hour
• Higher: Daily
• Conservative settings
This creates a multi-layered approach capturing opportunities across different timeframes.
RISK MANAGEMENT ENHANCEMENTS
Time-Based Exits:
• Manually close positions that don't reach targets within the expected timeframe
• Prevents capital from being tied up in stagnant trades
Correlation Management:
• Avoid taking signals on highly correlated instruments simultaneously
• Diversifies risk across uncorrelated assets
Maximum Daily Loss:
• Set a mental or coded limit (e.g., 3% account loss per day)
• Stop trading if the limit is hit
• Prevents emotional revenge trading
CONFIGURABLE PARAMETERS REFERENCE
RESOLUTION SETTINGS
Resolution | Default: 120 (2 hours)
Options | 1, 5, 15, 30, 60, 120, 240, 1D, 1W
Use Custom Resolution? | Default: False
Custom Resolution (Minutes) | Default: 160 | Range: 1+
RISK MANAGEMENT SETTINGS
Stop Loss (%) | Default: 2.0% | Range: 0.1%+
Take Profit (%) | Default: 5.0% | Range: 0.1%+
Risk Per Trade (%) | Default: 1.0% | Range: 0.1%+
Use Trailing Stop? | Default: False
Trailing Stop Offset (%) | Default: 1.0% | Range: 0.1%+
FREQUENTLY ASKED QUESTIONS
Q: What's the difference between this and a simple moving average crossover?
A: This strategy uses higher timeframe open/close crossovers, not MA crossovers. It's analysing candle closes versus opens, which represents actual buyer/seller commitment, not averaged price levels.
Q: Can I use this on any instrument?
A: Yes. It works on stocks, forex, crypto, commodities, indices—any market with reliable data on your chosen timeframes.
Q: Do signals repaint?
A: No. Signals are based on completed higher timeframe bars (using [1] offset), so they don't change once generated.
Q: Why am I getting so few signals?
A: Signals only appear when the higher timeframe close crosses its open. This is intentional—quality over quantity. Try using a smaller, higher timeframe resolution for more signals.
Q: Can I automate this strategy?
A: Yes. TradingView's strategy alerts can trigger webhooks to automation services or broker APIs for automated execution.
Q: What's the best resolution to use?
A: Depends on your chart timeframe and trading style. General rule: use a resolution 4-8x larger than your chart timeframe.
Q: Should I enable trailing stops?
A: In trending markets, yes. In choppy/ranging markets, no. Test both on historical data for your specific instrument.
Q: How do I avoid whipsaws?
A: Use a larger, higher timeframe resolution, add additional filters (like trend MAs), and only trade in trending market conditions.
Q: Can I modify the stop loss and take profit after entry?
A: The strategy sets them automatically at entry. For manual adjustment, you'd need to modify the code or manage manually in your broker platform.
Q: What win rate should I expect?
A: Typically 40-55% with default settings. The strategy is designed for larger winners than losers (positive risk-reward), so it can be profitable even with sub-50% win rate.
TECHNICAL SPECIFICATIONS
Platform: TradingView
Language: Pine Script Version 6
Strategy Type: Bidirectional (both long and short)
Position Sizing: Percentage of equity (default 10%)
Resolution System: Multi-timeframe with validation
Repainting: No (uses completed bar data)
Lookahead: Enabled (for v2 compatibility)
Default Timeframe: Works on all timeframes
Automation: Fully compatible with alerts and webhooks
STRATEGY PHILOSOPHY
The VELDORA Higher Trend-Strategy is built on a fundamental principle of technical analysis: higher timeframes matter more than lower timeframes.
When a 4-hour candle closes above its open, it represents 4 hours of buyers pushing price higher—far more significant than a 5-minute bullish candle. By anchoring our entry signals to these higher timeframe confirmations while executing on lower timeframes, we gain the best of both worlds: the reliability of higher timeframe analysis with the precision and flexibility of lower timeframe execution.
The strategy doesn't try to predict the future or catch every move. Instead, it waits patiently for clear evidence of directional commitment on a meaningful timeframe, then executes with predefined risk parameters. This removes emotion, provides consistency, and creates a repeatable edge.
Whether you're a scalper looking for intraday momentum, a swing trader targeting multi-day moves, or a position trader seeking long-term trends, the adjustable resolution system adapts to your timeframe while maintaining the core logic: trade with the trend confirmed by higher timeframe price action.
BEST PRACTICES SUMMARY
✓ ALWAYS choose a higher resolution 4-8x larger than your chart timeframe
✓ BACKTEST your settings thoroughly before live trading
✓ START with default parameters and optimise gradually
✓ USE proper position sizing (1-2% risk per trade recommended)
✓ HONOR your stop losses without exception
✓ TRACK your trades in a journal to identify patterns
✓ AVOID trading during major news events
✓ ADAPT parameters to market conditions (trending vs. ranging)
✓ COMBINE with additional analysis (S/R, volume, patterns)
✓ PAPER TRADE for at least 20-30 signals before going live
Ready to test the VELDORA Higher Trend-Strategy?
Load it on your TradingView charts and discover the power of multi-timeframe analysis! Questions? Need support? Want to share your results?
Contact us and Happy Trading
DISCLAIMER:
These trading strategies are provided for educational and informational purposes only. Past performance does not guarantee future results. Trading involves substantial risk of loss and is not suitable for all investors.
The strategy's performance will vary significantly based on market conditions, parameter settings, instrument selection, and the timeframe chosen. No trading strategy can guarantee profits or eliminate risk.
Always conduct thorough backtesting and forward testing before deploying any strategy with real capital. Consider your financial situation, risk tolerance, and trading experience before using this or any automated trading system. Consult with a licensed financial advisor if you have questions about trading or investing.
The creator of this strategy makes no warranties or guarantees regarding its accuracy, performance, or profitability. You are solely responsible for your trading decisions and their outcomes.
Use of leverage, margin, and automated trading systems can result in rapid and substantial losses. Never trade with money you cannot afford to lose.
Add comment
Comments